Most of the effort in real analysis is not analysis. It is getting the data into a state where analysis means anything. The good news is that cleaning is a checklist, not a talent - and doing it properly matters more than the sophistication of what you do next.
Before anything: make a copy
Never clean the original. Keep a raw copy untouched, work on a duplicate, and write down every change you make. When someone asks why your figure differs from theirs six weeks later, that log is the only thing that will save you.
The cleaning checklist
1. One row per thing, one column per attribute. Data laid out for human reading - merged cells, subtotals in the middle, headers repeated every 20 rows - cannot be analysed. Flatten it first.
2. Fix data types. Numbers stored as text will not sum. Dates in three different formats will not sort. This is the single most common source of wrong answers in spreadsheets.
3. De-duplicate carefully. Look for near-duplicates, not just exact ones: "Acme Ltd", "Acme Limited" and "ACME ltd." are one customer. Sort alphabetically and scan.
4. Deal with blanks deliberately. A blank can mean zero, unknown, or not applicable - and they are not interchangeable. Decide per column, document the decision, and never let a spreadsheet silently treat unknown as zero.
5. Investigate outliers, do not delete them. An order of £480,000 might be a data entry error, or your best customer. Check before removing anything; deleting inconvenient values is how analysis becomes fiction.
6. Sanity-check the totals. Does your row count match the source system? Does revenue tie to the accounts? If it does not reconcile, stop - you have the wrong extract.
Then analyse, in this order
- Count things. How many rows, how many customers, what date range. Half of all questions are answered here.
- Summarise each column. Min, max, mean, median. Anything absurd is a cleaning problem you missed.
- Segment. By month, region, product, customer type. Almost every interesting finding lives in a comparison between groups, not in a total.
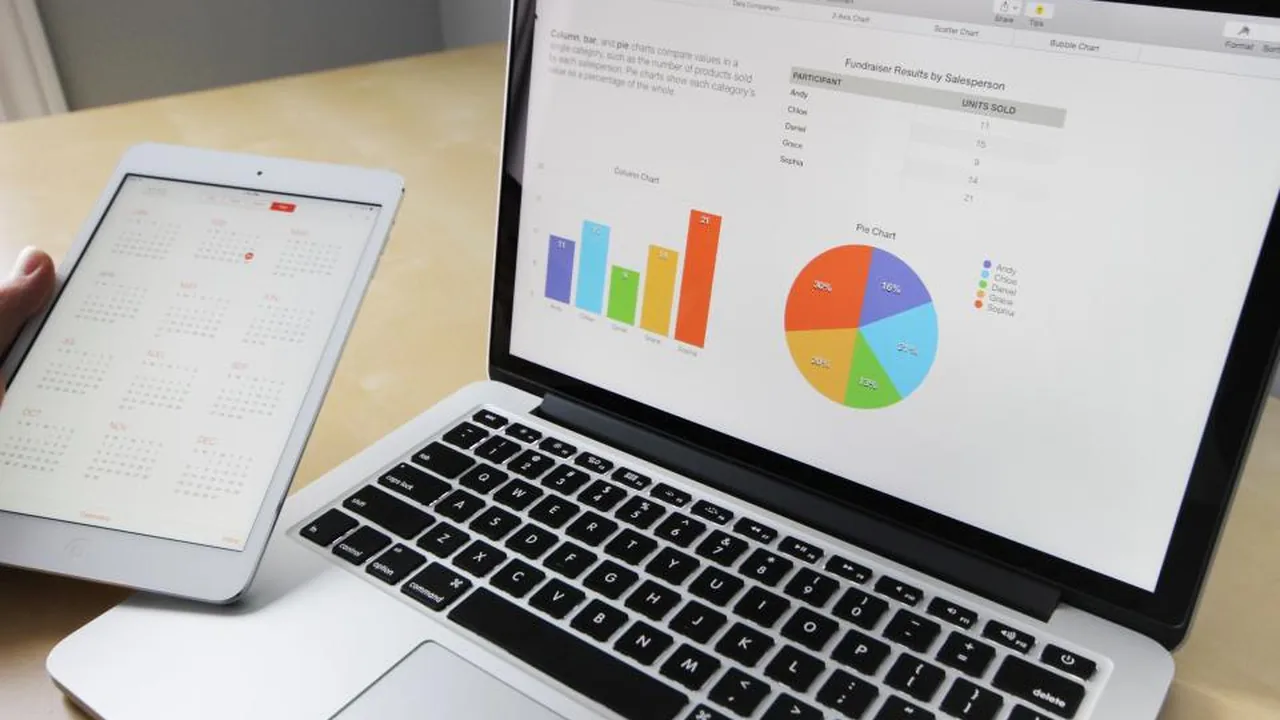
- Chart it. A line chart over time and a bar chart by group will show you more in thirty seconds than a table of numbers in an hour.
- Only then test. Once you have a specific claim, check whether it survives a test of significance.
The three questions to ask before you believe your own analysis
- Where did this data come from, and who or what is missing from it? Data from your CRM excludes everyone who never became a lead.
- Could the pattern be explained by something else changing at the same time? Seasonality, a price change, a marketing campaign.
- How much would this number normally move anyway? If you do not know the normal variation, you cannot interpret the change.
Tools you need
A spreadsheet, honestly. Power Query or the equivalent for repeatable cleaning, and a pivot table for summarising. See the tools worth learning if you want to go further.
The Statistics for Business course works with realistic, messy business data rather than pre-cleaned textbook sets. Enquire today.